Streamline access with secure, user-friendly login pages that enhance the candidate and client experience. These templates feature intuitive design, password recovery, and multi-device compatibility—ensuring smooth entry while protecting sensitive data.
Register Template
Simplify onboarding with registration pages designed for speed and clarity. These templates guide candidates and clients through account creation with intuitive steps, secure data handling, and mobile-friendly layouts—turning sign-ups into lasting relationships.
Job Search Template
Empower candidates to find the right role quickly. These templates feature advanced filters, keyword search. Creating a seamless experience that keeps users engaged and drives more applications.
Job Ad Template
Showcase opportunities with job ad templates that grab attention and convert. Highlight key details, benefits, and company culture in a clean, optimized layout—helping you attract top talent and stand out in competitive markets.
Job Application Template
Turn interest into action with application templates built for simplicity and trust. These layouts support CV uploads, multi-step forms, and progress indicators—reducing drop-offs and ensuring candidates complete their applications with confidence.
Consultant Profile Templates
Showcase your recruitment team with professional profile pages that build trust and credibility. These templates include photo galleries, expertise tags, contact forms, and testimonials—helping candidates connect with the right specialist for their industry.
Blog & Content Templates
Pre-built blog layouts designed to establish your recruitment brand as a thought leader. Choose from article grids, featured post sliders, and category-filtered views that make it easy to share industry insights, attract organic traffic, and engage both candidates and clients.
About Us
Your story is your strongest asset. These templates help you showcase your mission, values, and team culture in a way that builds trust and emotional connection. Position your agency as a credible partner by highlighting expertise, achievements, and the people behind your success.
Industry & Discipline Templates
Sector-specific landing pages that showcase your expertise in IT, Finance, Healthcare, Engineering, and more. Each template includes industry insights, relevant job feeds, specialist consultant profiles, and targeted content to attract niche talent.
General Content Templates
Create a strong first impression with versatile content layouts that adapt to any purpose. These templates help you share company updates, industry insights - building trust and keeping your audience informed across every touchpoint.
Lead Capture Templates
Forms optimized for CV uploads, callback requests, and general enquiries. Features include customisation for responses to ensure no lead goes cold.
Clients Template
Showcase the businesses you partner with and the success you deliver. These templates highlight client logos, case studies, and testimonials in a visually compelling way to help build trust, reinforce credibility, and attracting new partnerships through proven results.
Events & Webinar Templates
Promote career fairs, networking events, and webinars with registration-enabled templates. Includes calendar views and past event galleries—perfect for building community engagement and attracting quality candidates.
Branch & Location Templates
Multi-location templates with integrated maps, local team profiles, and regional job feeds. Perfect for recruitment agencies with multiple offices, these layouts help candidates find their nearest branch and connect with local market experts.
Candidates Template
Put candidates at the center of your recruitment experience. These templates showcase personalized dashboards, saved job features, and tailored content—helping job seekers feel supported, informed, and confident throughout their career journey.
Employers Template
Build trust with employers through dedicated templates that highlight your services, success metrics, and client-focused resources. Present case studies, industry insights, and easy enquiry options—positioning your agency as a strategic partner for talent acquisition.
Testimonials Template
Turn feedback into powerful social proof. These templates feature client reviews, candidate success stories, and detailed case studies—building credibility and influencing decisions by showcasing real-world results and measurable impact.
Data-driven Diversity Reports: Understanding your job applicant trends, gaps and opportunities
Data-driven Diversity Reports: Understanding your job applicant trends, gaps and opportunities
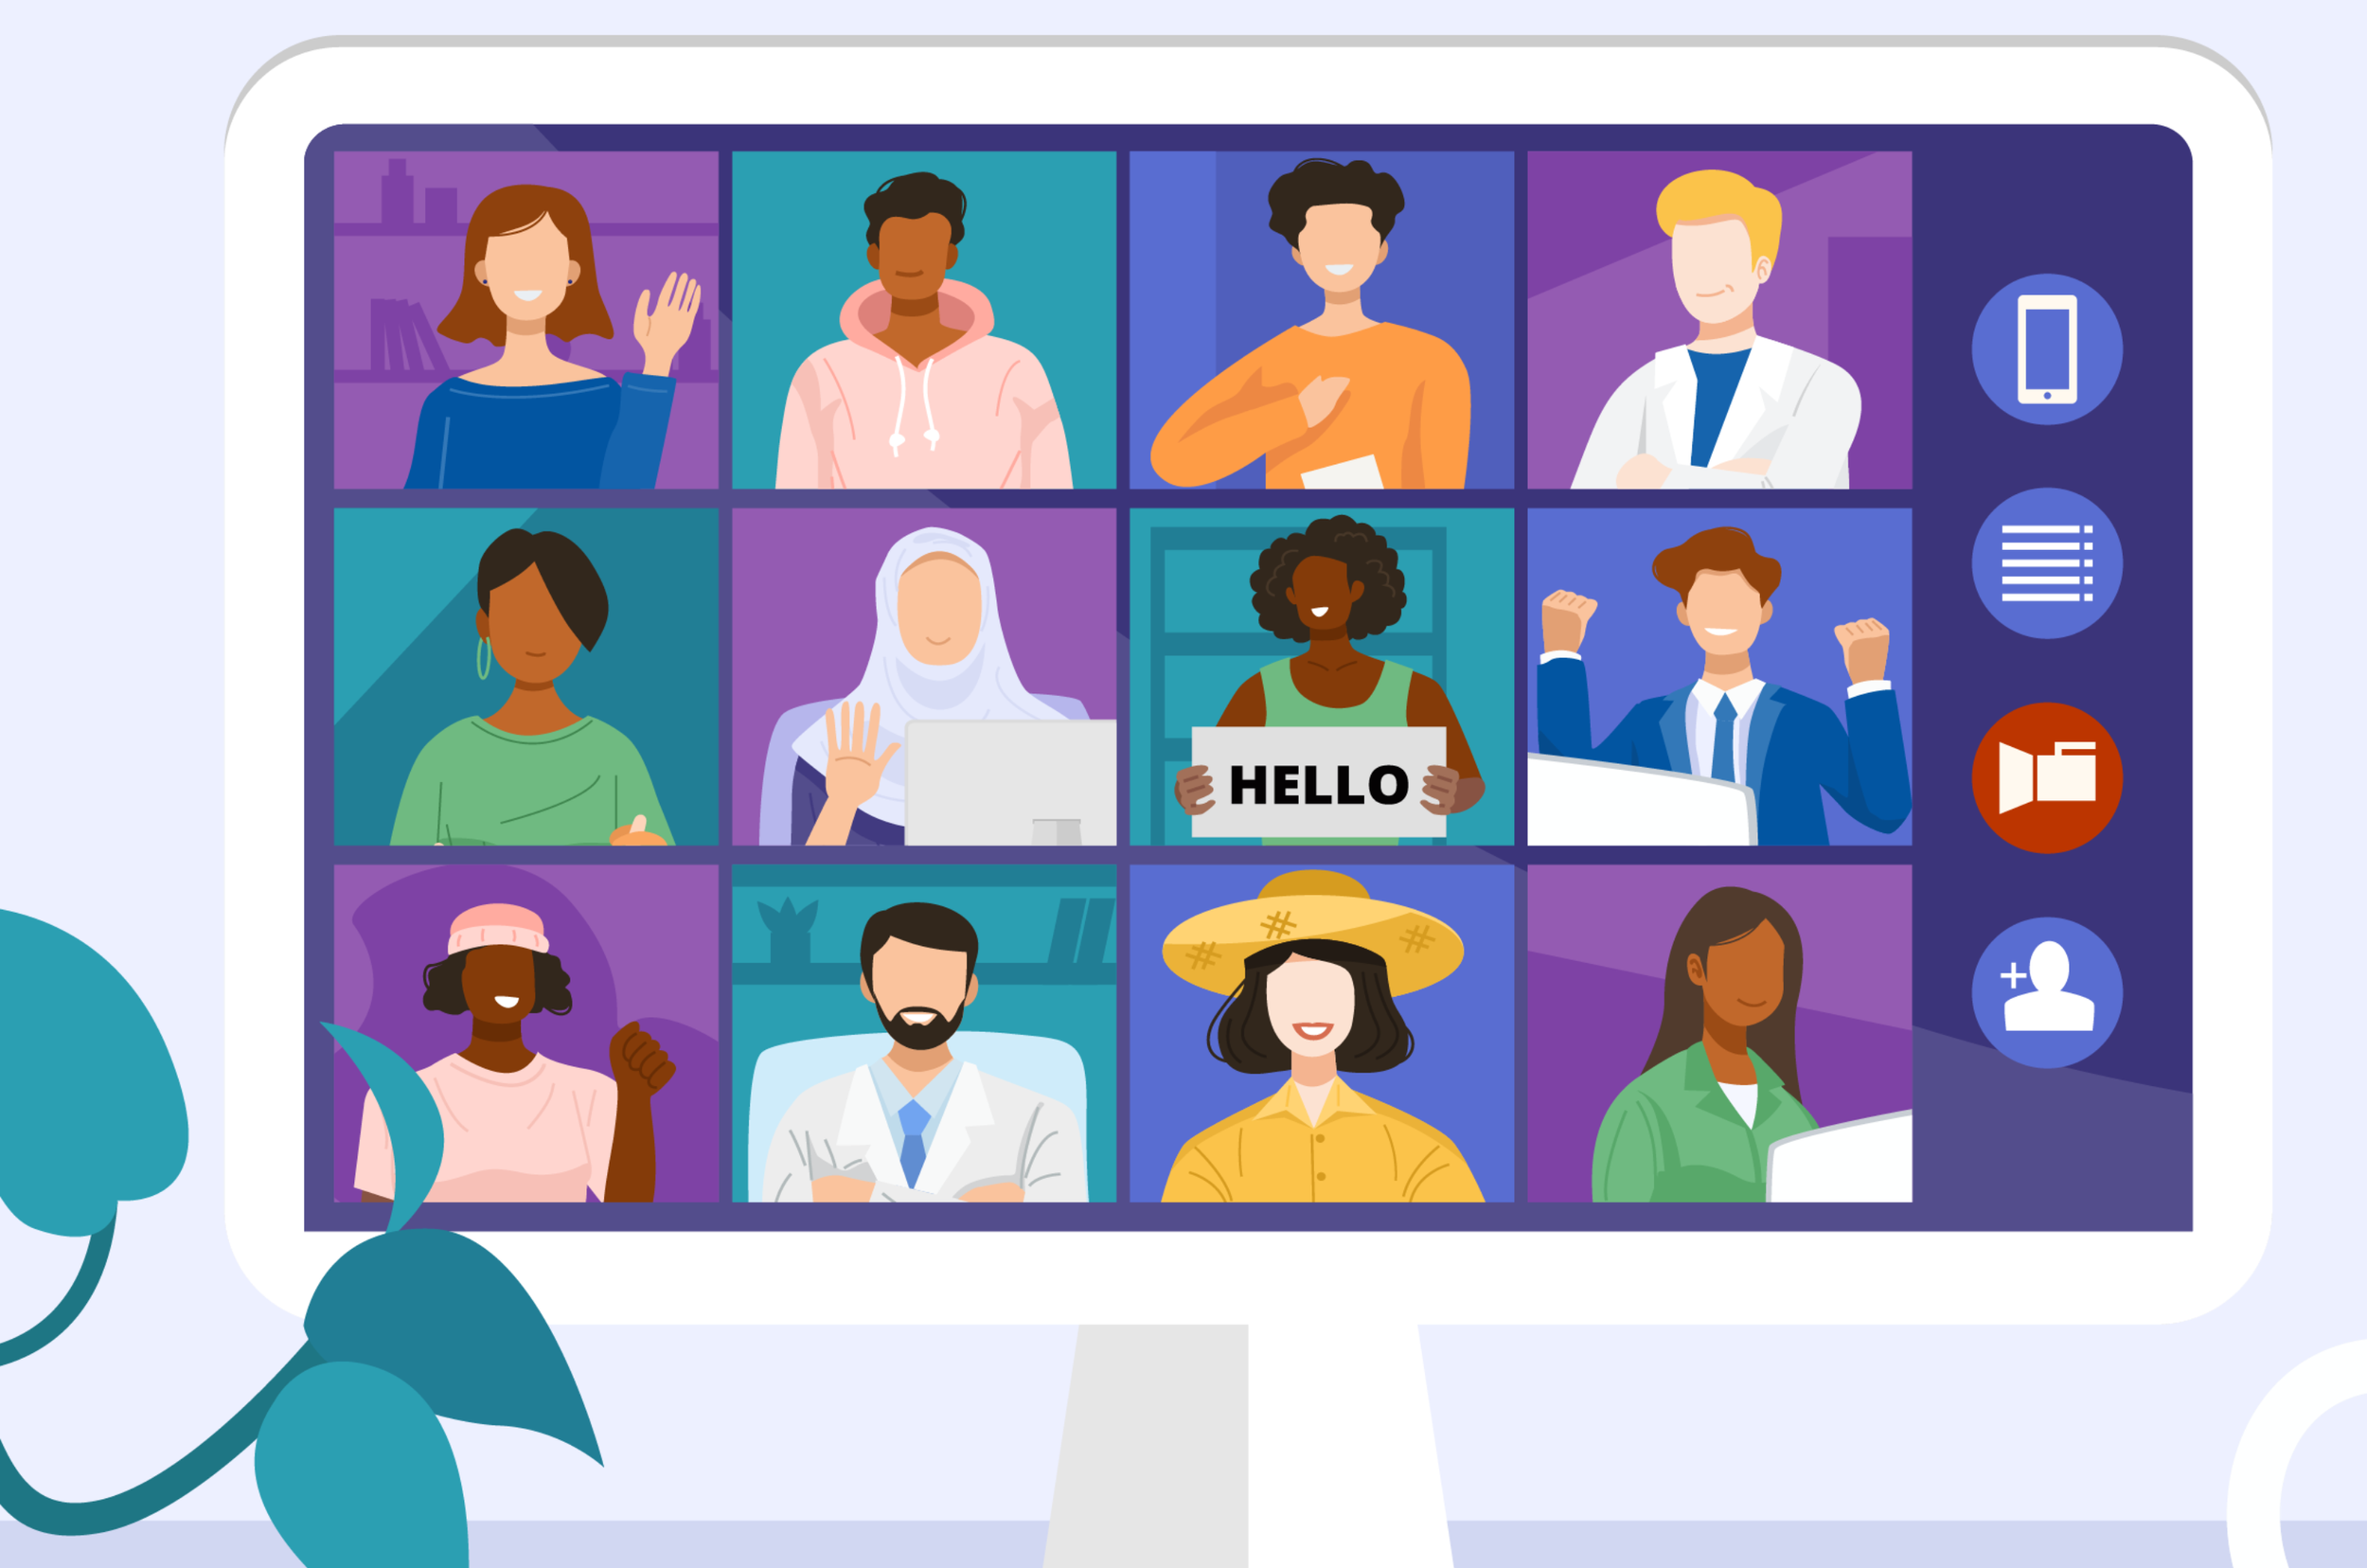
Diversity insights for your clients and internal teams
76 percent of agencies are asked about DE&I by their clients. Requests for diversity data are by far the most common, reveals our latest [survey] among recruitment leaders in the UK.
In the same survey, 40 percent of recruitment consultants report a lack of diversity data and struggles generating insights. Highly manual data collection, without fit-for-purpose tools, cited as main reason. This is exactly where your Diversity Dashboard can help you track and report relevant data.
IN THIS KNOWLEDGE ARTICLE WE’LL BE SHARING:
WHY DIVERSITY DATA INSIGHTS ARE GAME-CHANGING FOR YOUR RECRUITMENT BUSINESS
HOW VOLCANIC’S DIVERSITY DASHBOARD HELPS YOU TO OBTAIN AND USE YOUR DIVERSITY DATA AND INSIGHTS
HOW DIFFERENT VIEWS BY CLIENT, COUNTRY, DISCIPLINE MIGHT HELP
WAYS IN WHICH TO EXTRACT THE DATA FROM VOLCANIC
Why diversity data insights are game-changing for your recruitment business to…
WIN NEW CLIENTS AND BUSINESS
DIFFERENTIATING FACTOR:
The majority of recruitment RFP’s in todays market contain DE&I questions, most commonly about the availability of diversity data tracking and reporting. Having globally relevant and compliant tracking in one dashboard at your fingertips, can be a highly differentiating factor in a market where many agencies are still scrambling for solutions.
DEMONSTRATE PROGRESS:
Regularly collecting and analyzing diversity data of your (clients) talent pipeline, enables you to measure progress over time, internally and on behalf of your clients. This data-driven approach allows you to demonstrate the effectiveness of various strategies for your clients.
REALISTIC DIVERSITY GOALS:
About a quarter of clients task their recruitment agencies with candidate diversity targets, most commonly across gender and ethnicity. Understanding your current data can prove a valuable starting point to have informed conversations with your clients about their diversity goals, and whether they are relevant and achievable.
WIN AND ENGAGE CANDIDATES
TRANSPARENCY BUILDS TRUST:
For 3 out of 4 job seekers, DE&I is an important criteria in selecting their next role and employer. Pro-actively sharing your talent pipeline diversity data and the steps taken to ensure a fair, equitable and accessible recruitment journey, enhances your credibility with job seekers and can lead to stronger relationship.
MITIGATING BIAS:
By identifying patterns in diversity data, you can uncover instances of bias and discrimination within your processes. This awareness can lead to corrective actions and a more equitable recruitment processes that will benefit candidates, especially those from under-represented backgrounds and identities.
IMPROVE HOW YOU WORK
BETTER DECISION-MAKING:
Having access to diversity data allows for informed decision-making. You can tailor your policies, practices, and initiatives based on data-driven insights, ensuring that resources are allocated effectively to address specific diversity challenges that are important to you and your clients.
ACCESSIBLE AND INCLUSIVE PRACTICES:
Diversity data can guide the development of practices that are inclusive of and cater to the needs of various underrepresented groups. This could involve expanding recruiting networks, and crafting job descriptions to appeal to a broader range of candidates. Or for example, if data indicates challenges faced by job seekers with disabilities, you can implement accessibility measures on your website.
In summary, diversity data insights provide organizations with a foundation for creating more inclusive and equitable workplaces and talent pools. By analysing this data and using it to inform your strategies and practices, as an agency you can lead the way for D&I in your industries.
As a key differentiating factor, this will set you apart from your competitors to win both clients and candidates.
How Volcanic’s Diversity Dashboard helps you to obtain and use your diversity data and insights?
In previous knowledge articles we’ve already explored:
To make your diversity insights widely accessible, Diversely offers three ways to view, extract and share your talent pipeline diversity data from the platform:
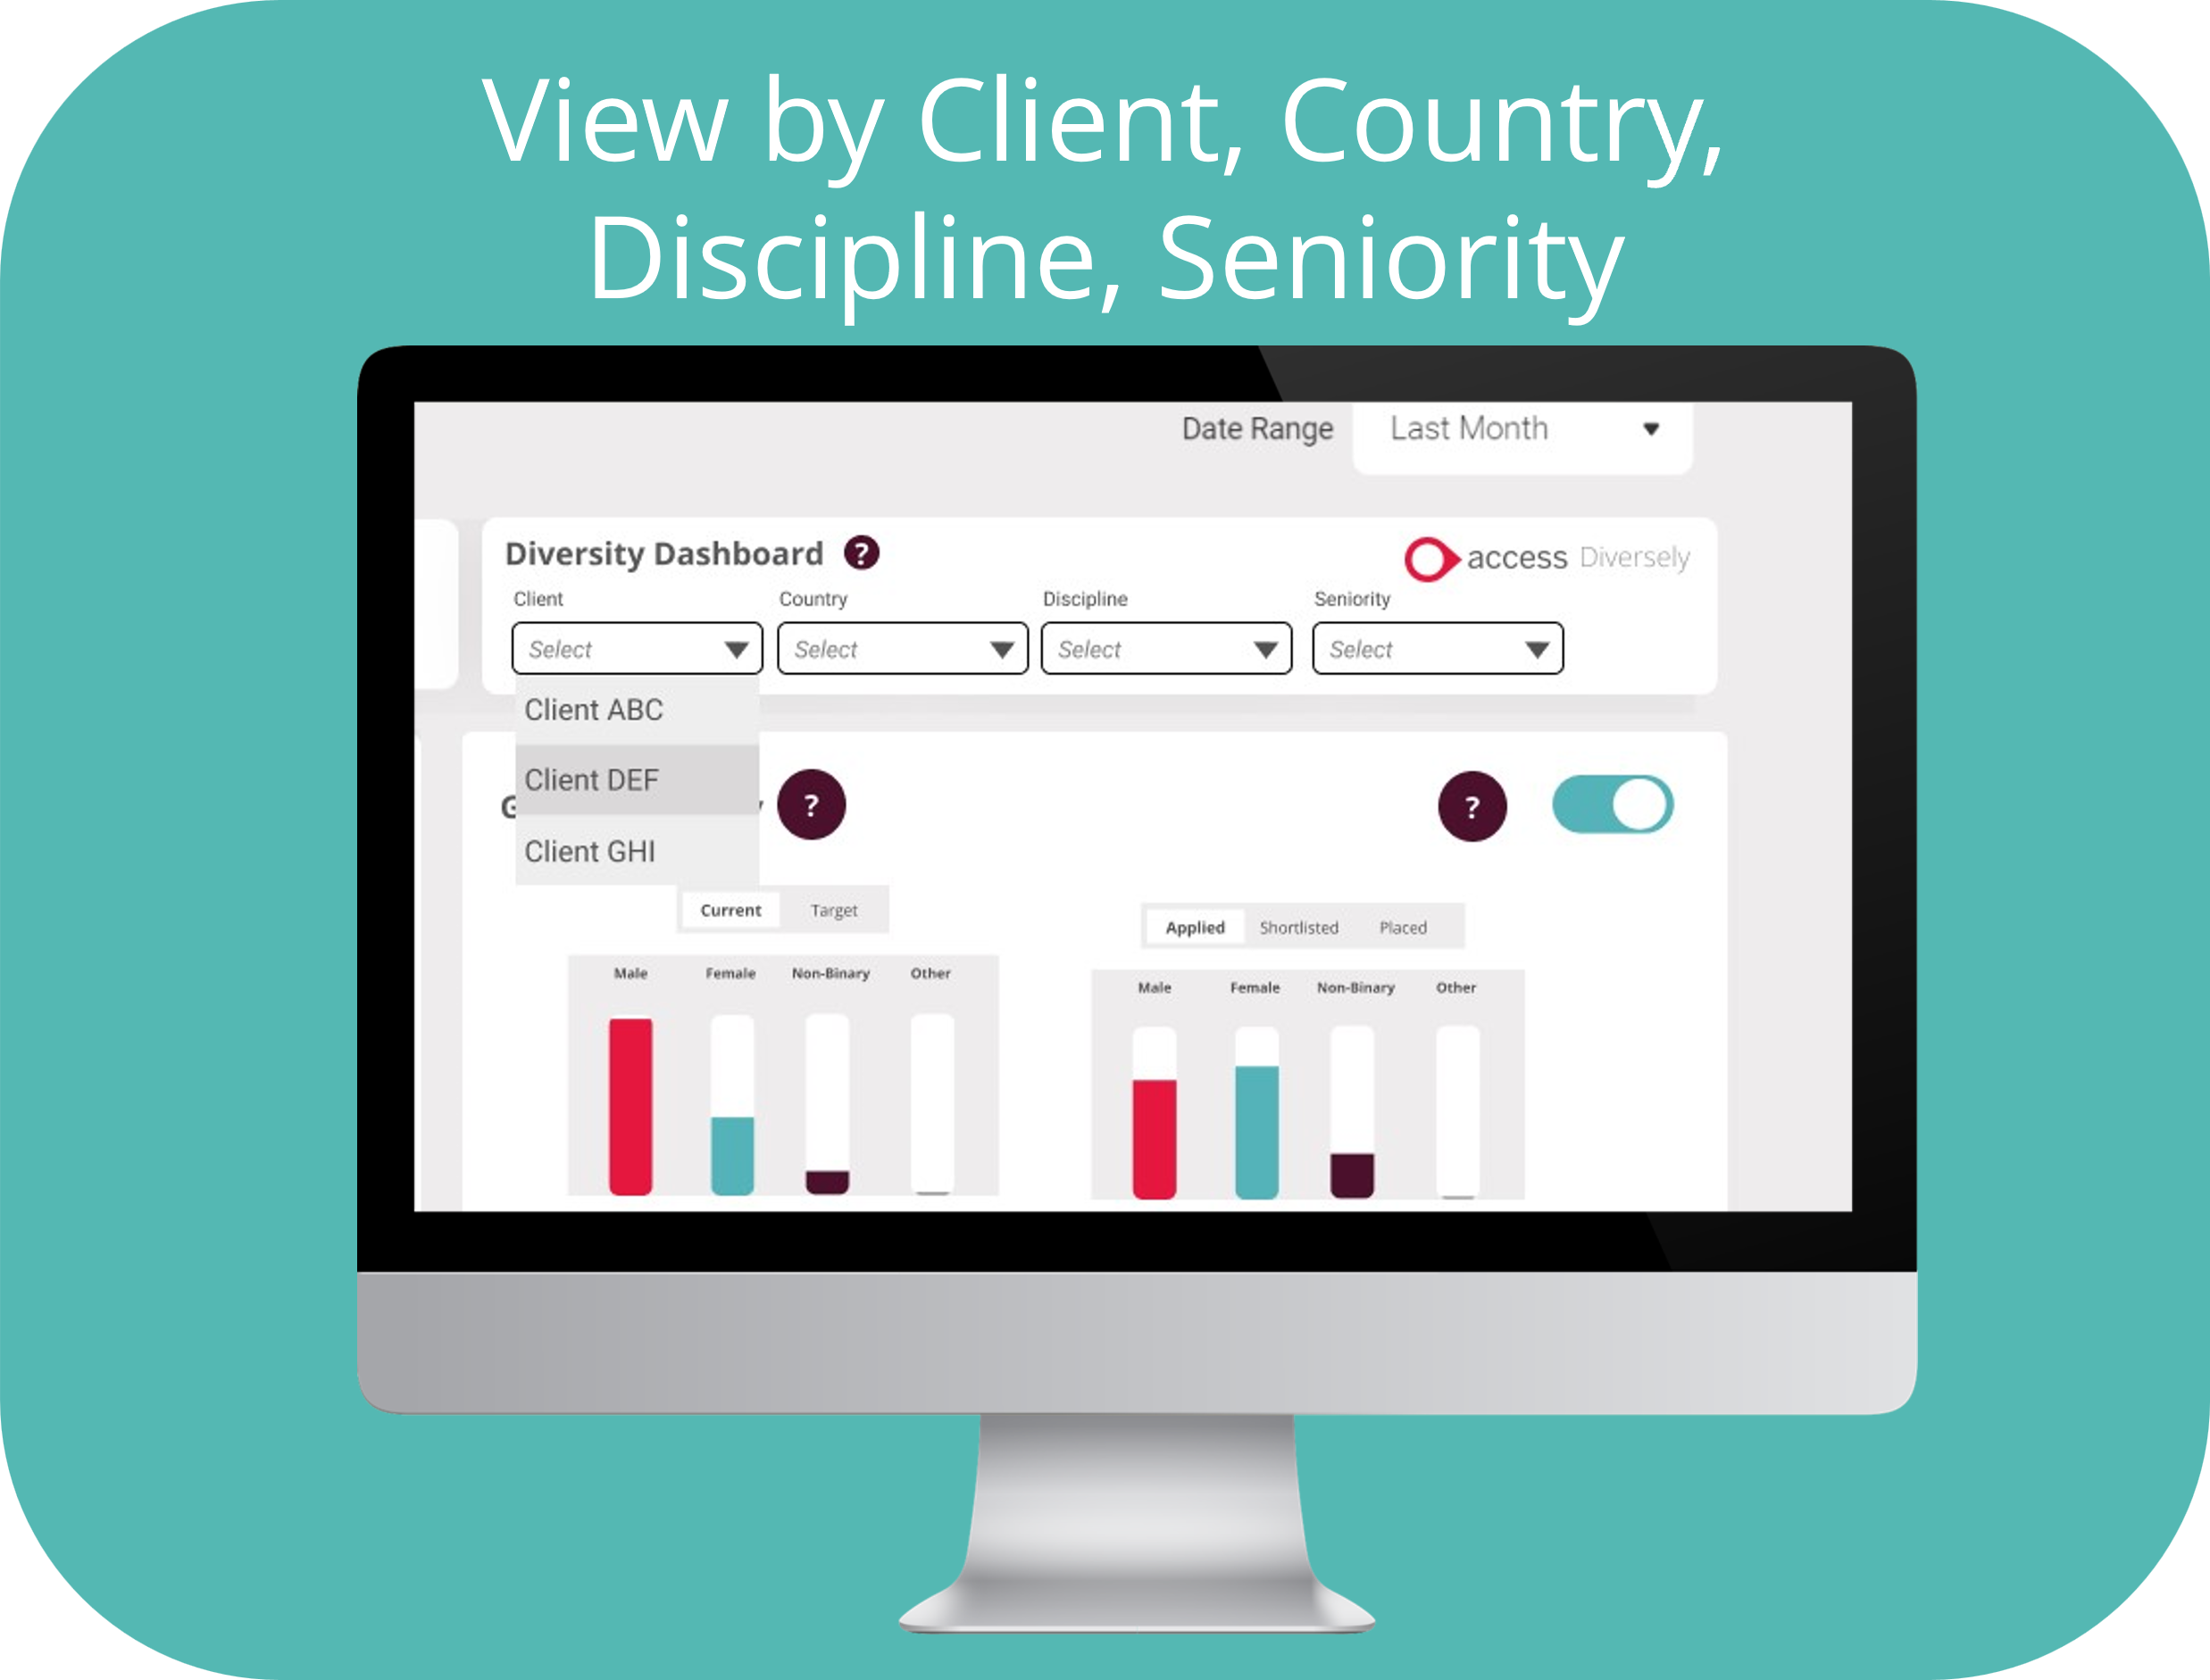
CREATE SPECIFIC DIVERSITY VIEWS ACROSS CLIENTS, COUNTRIES, DISCIPLINES AND SENIORITY, USING THE FILTERS AT THE TOP OF THE DIVERSITY DASHBOARD
EXTRACT AND SHARE YOUR DIVERSITY DATA AND GRAPHS, AMONGST YOUR TEAMS OR WITH YOUR CLIENTS
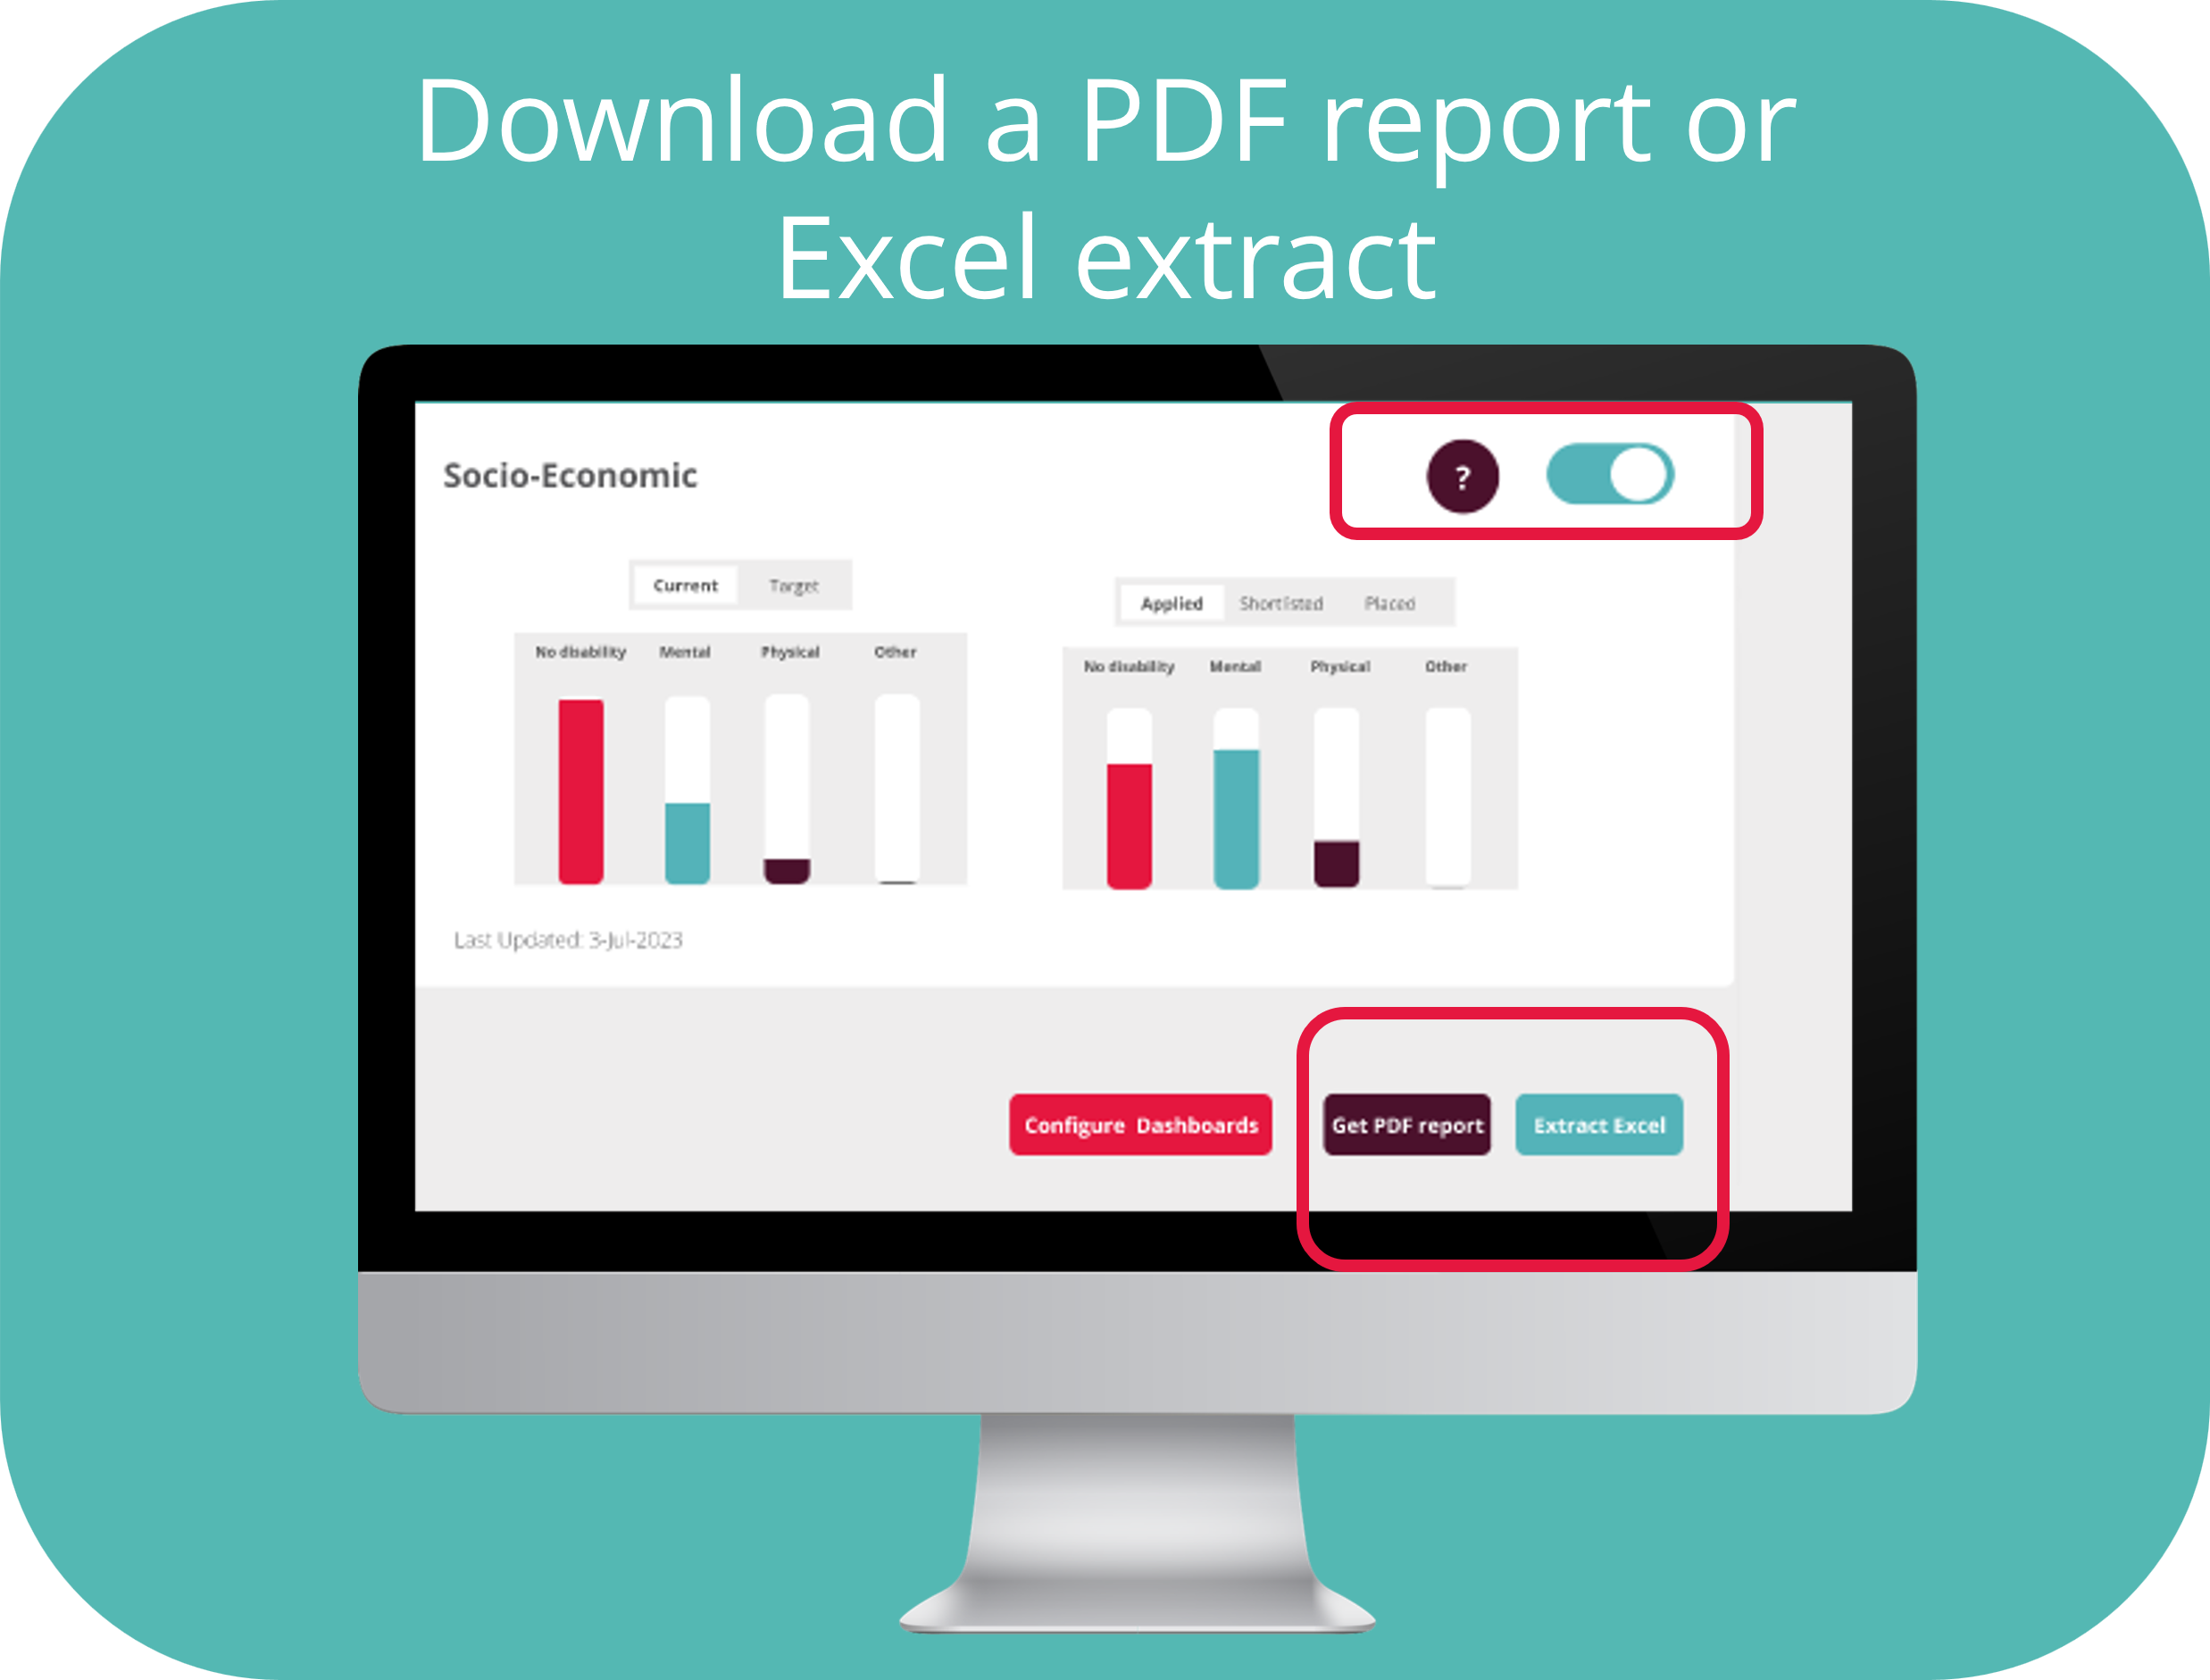
Download your diversity graphs in PDF format, to get an easy to share view of your dashboard
Extract your raw diversity data in excel format, to complete whichever analyses you’d like…
COMING SOON: Easily share your diversity graphs with clients and candidates on your website and/or job application, using the share toggle.
1. Diversity views by client, country, discipline, seniority
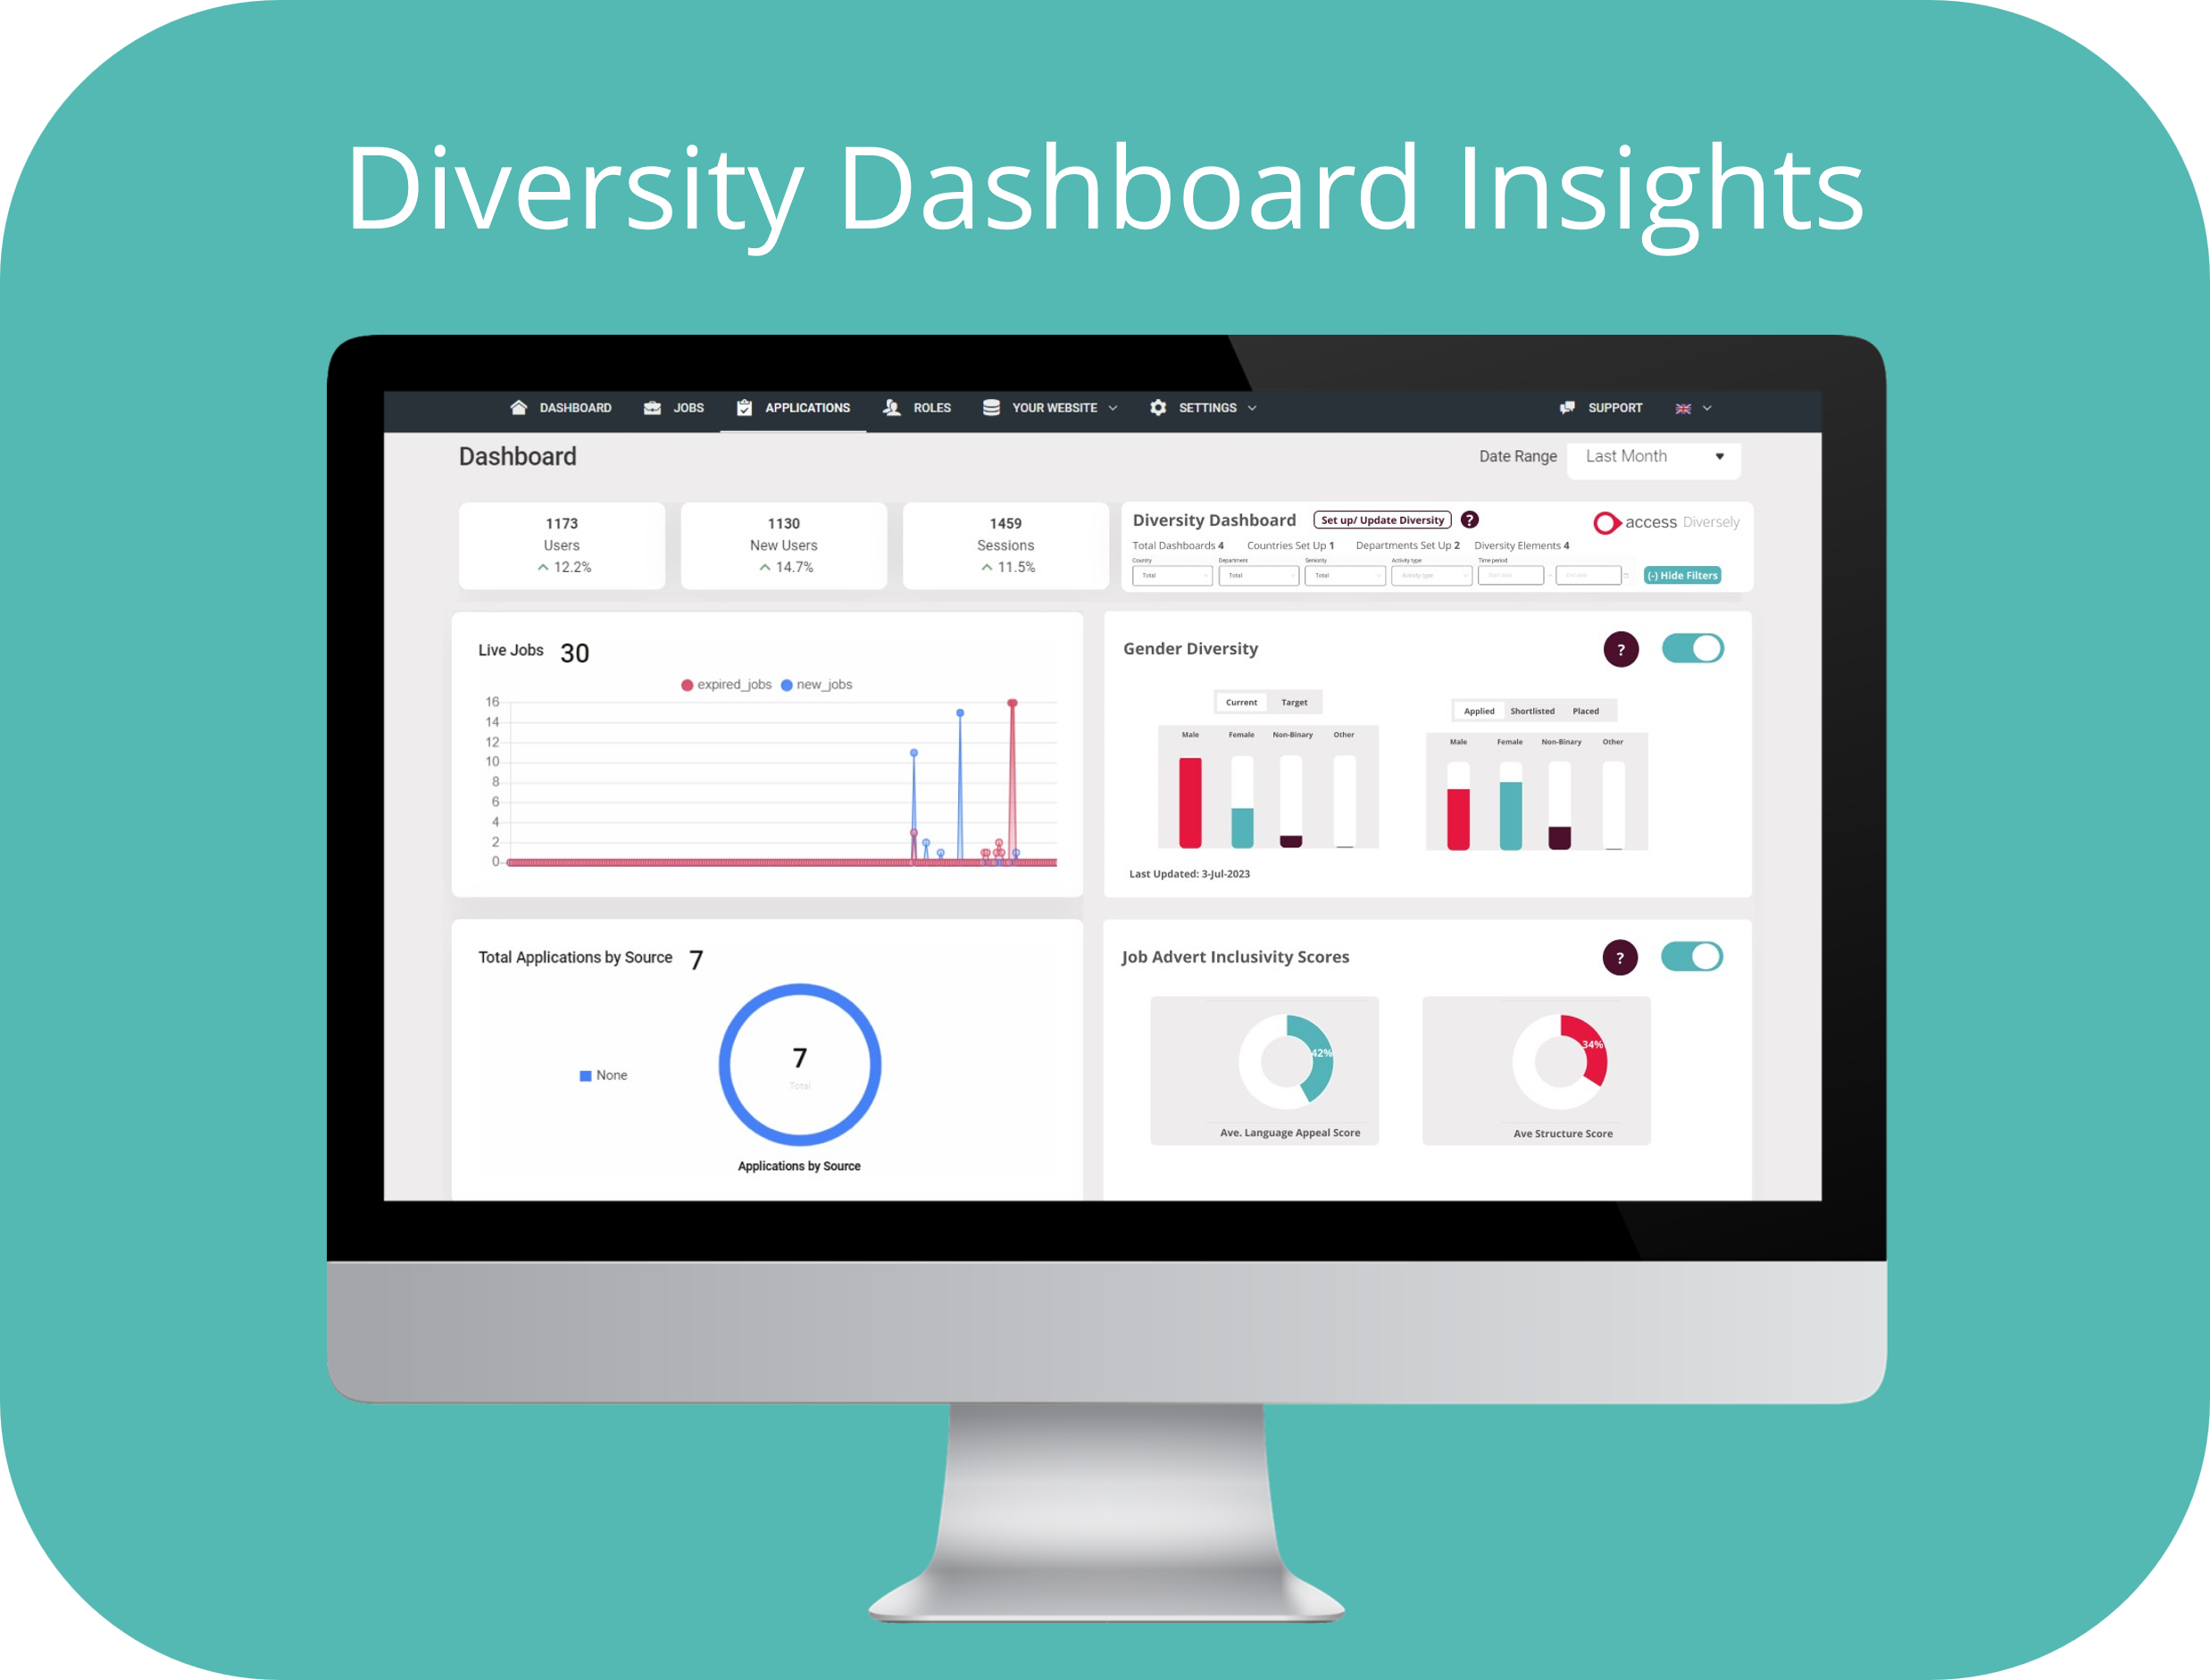
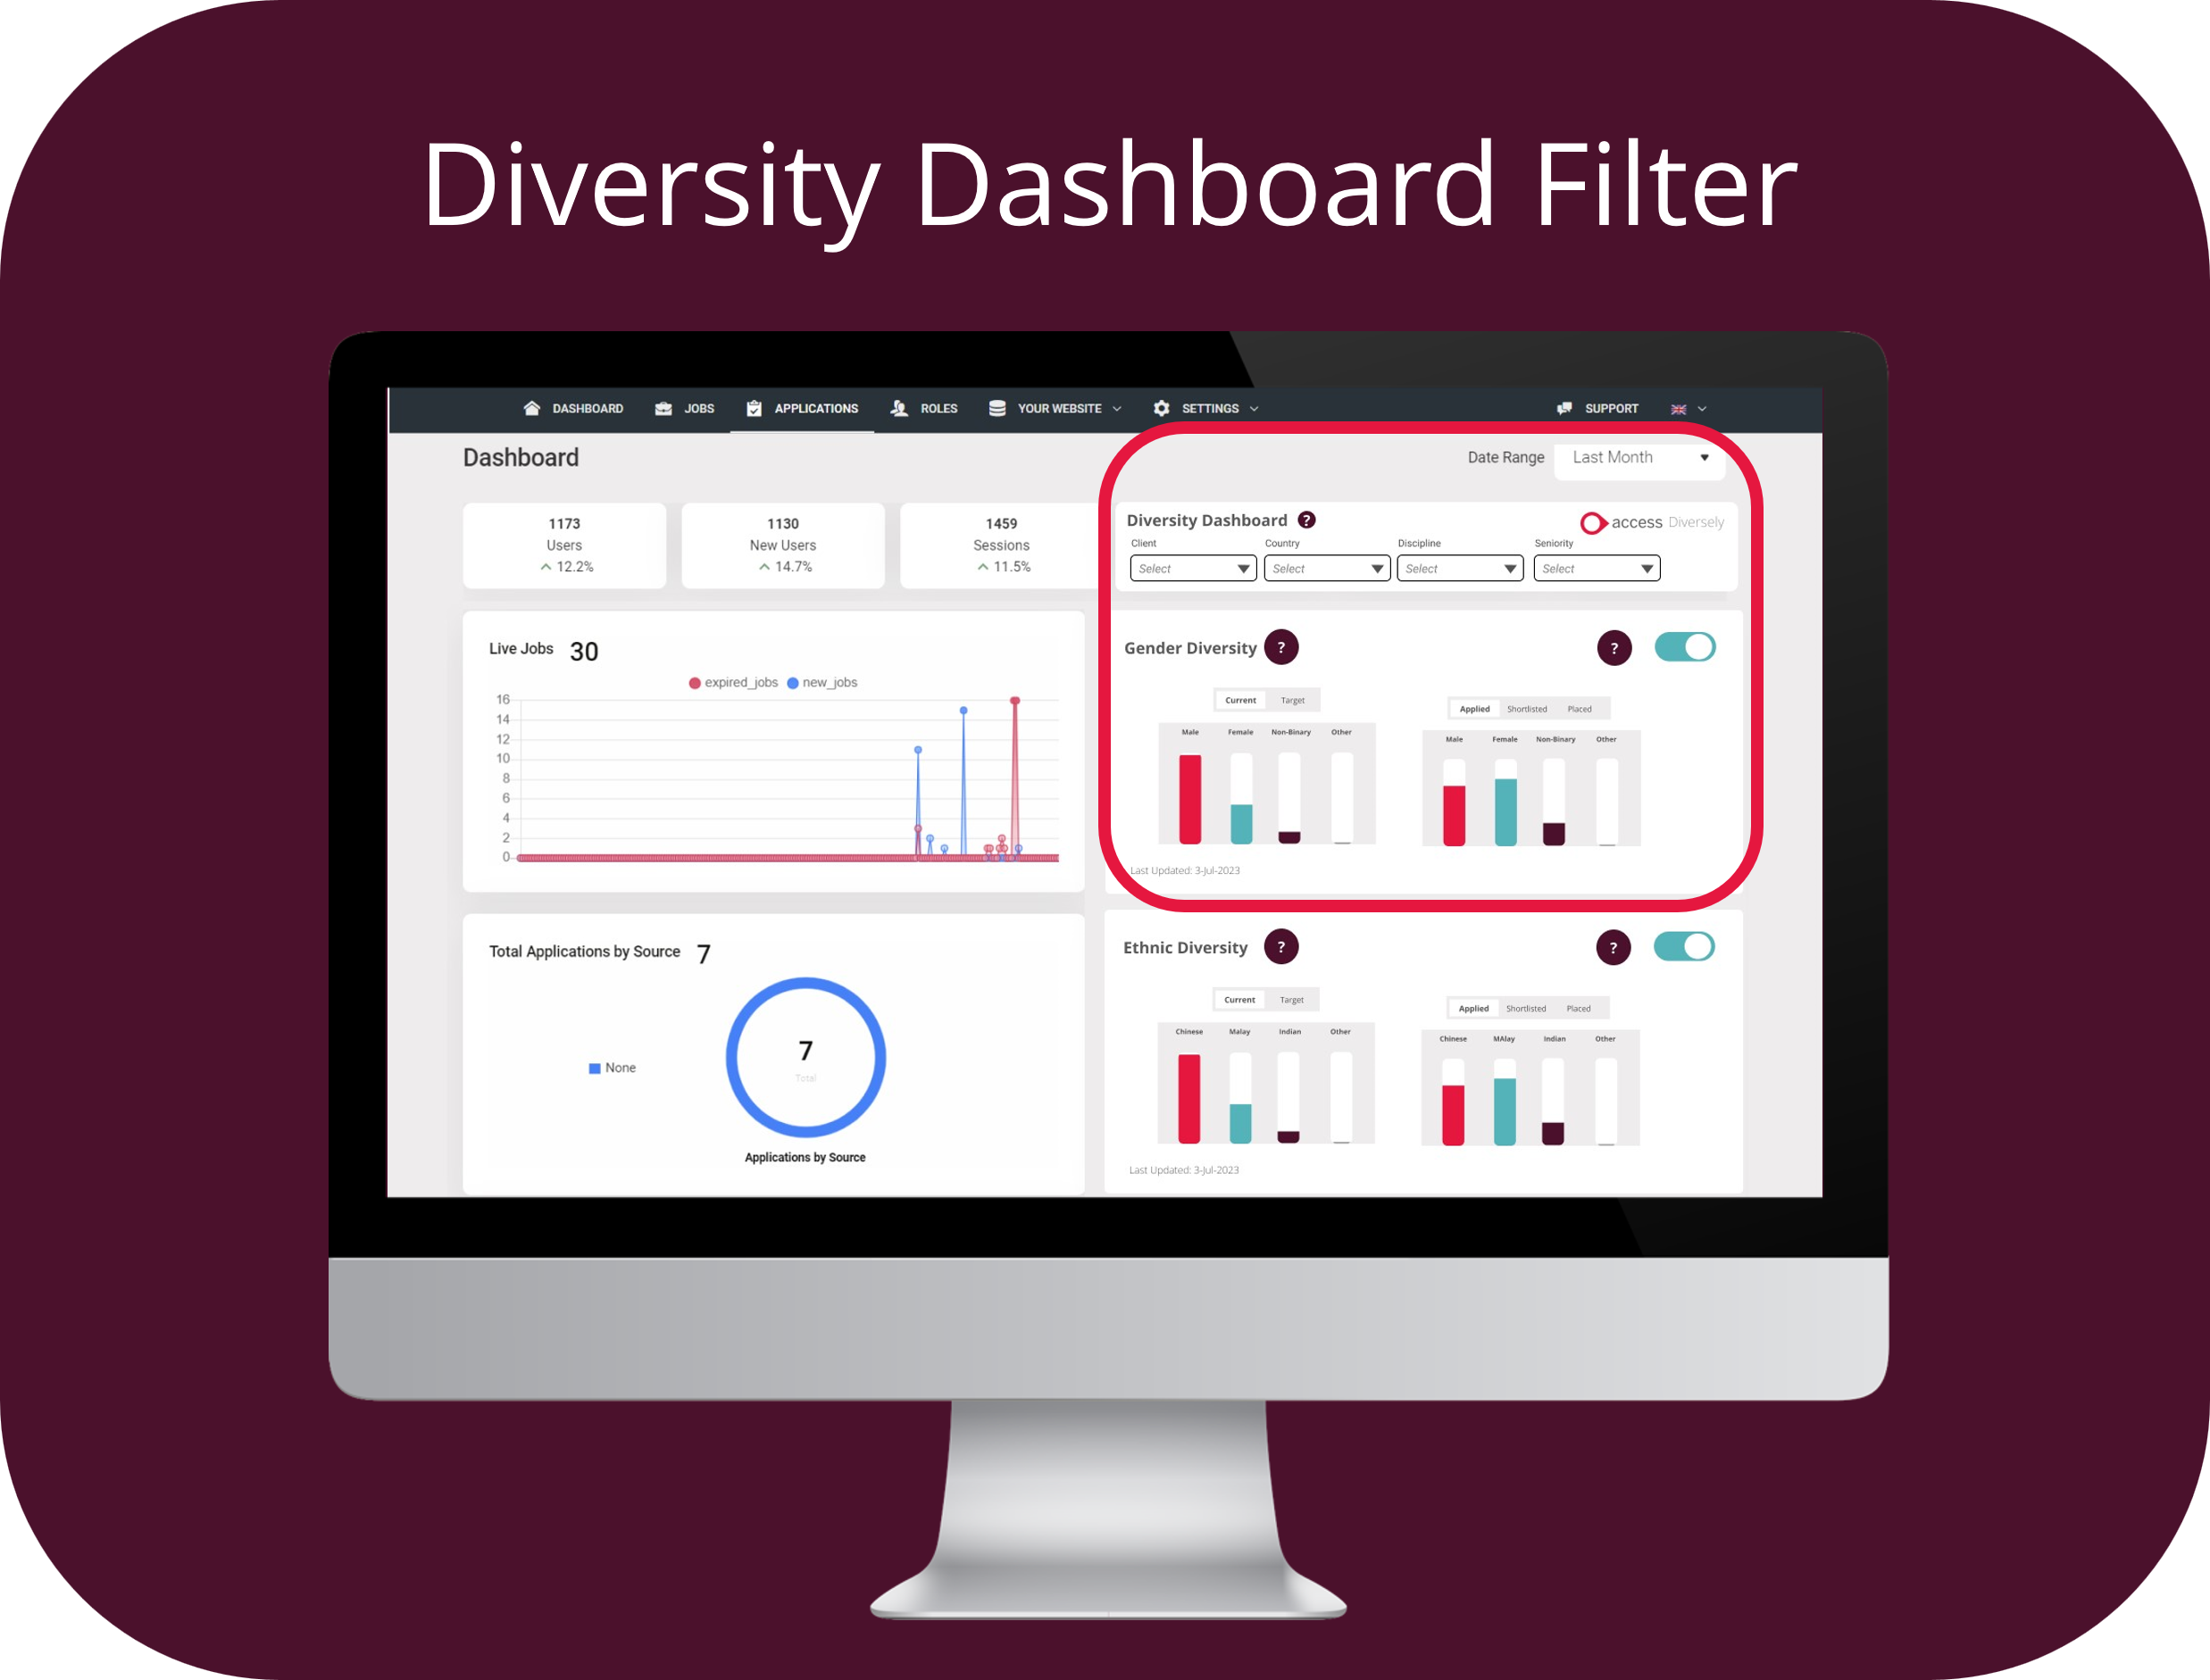
In your Volcanic dashboard, you’ll find your diversity dashboard on the right. At the top, you’ll find 4 filter options:
Client filter: You may want to just see your talent pipeline data for a specific clients, either because the client has requested their data, or for internal reasons. To allow filtering by clients, you’ll need to have added clients in your Volcanic reference data and have assigned jobs to clients. Once done, you can select clients from the drop-down list in your dashboard and view the filtered data.
Country filter: If you operate globally, you may want to see your talent pipeline data for a specific country. You can select a relevant country from the drop-down list to filter the data view accordingly. D&I means different things in different places, particularly from a race/ ethnicity perspective, but also across other characteristics. You may want to consider setting up specific custom dashboard configuration, if you recruit frequently in certain countries.
Discipline filter: Similarly to your client filter, you will need to set up disciplines in your Volcanic reference data and make sure to assign disciplines to your jobs. Once these steps are completed, you would be able to view diversity analytics for a specific discipline only e.g. Human Resources. You can imagine the diversity profile, from a gender perspective might look quite different for a Marketing discipline, compared to a Technology discipline.
COMING SOONSeniority filter: Once the ‘Seniority’ data field has been added to the Job Specification form, and you start assigning seniority to jobs, you’ll be able to filter your diversity by seniority. The diversity profile of job applicants might different significantly for entry roles compared to senior leadership.
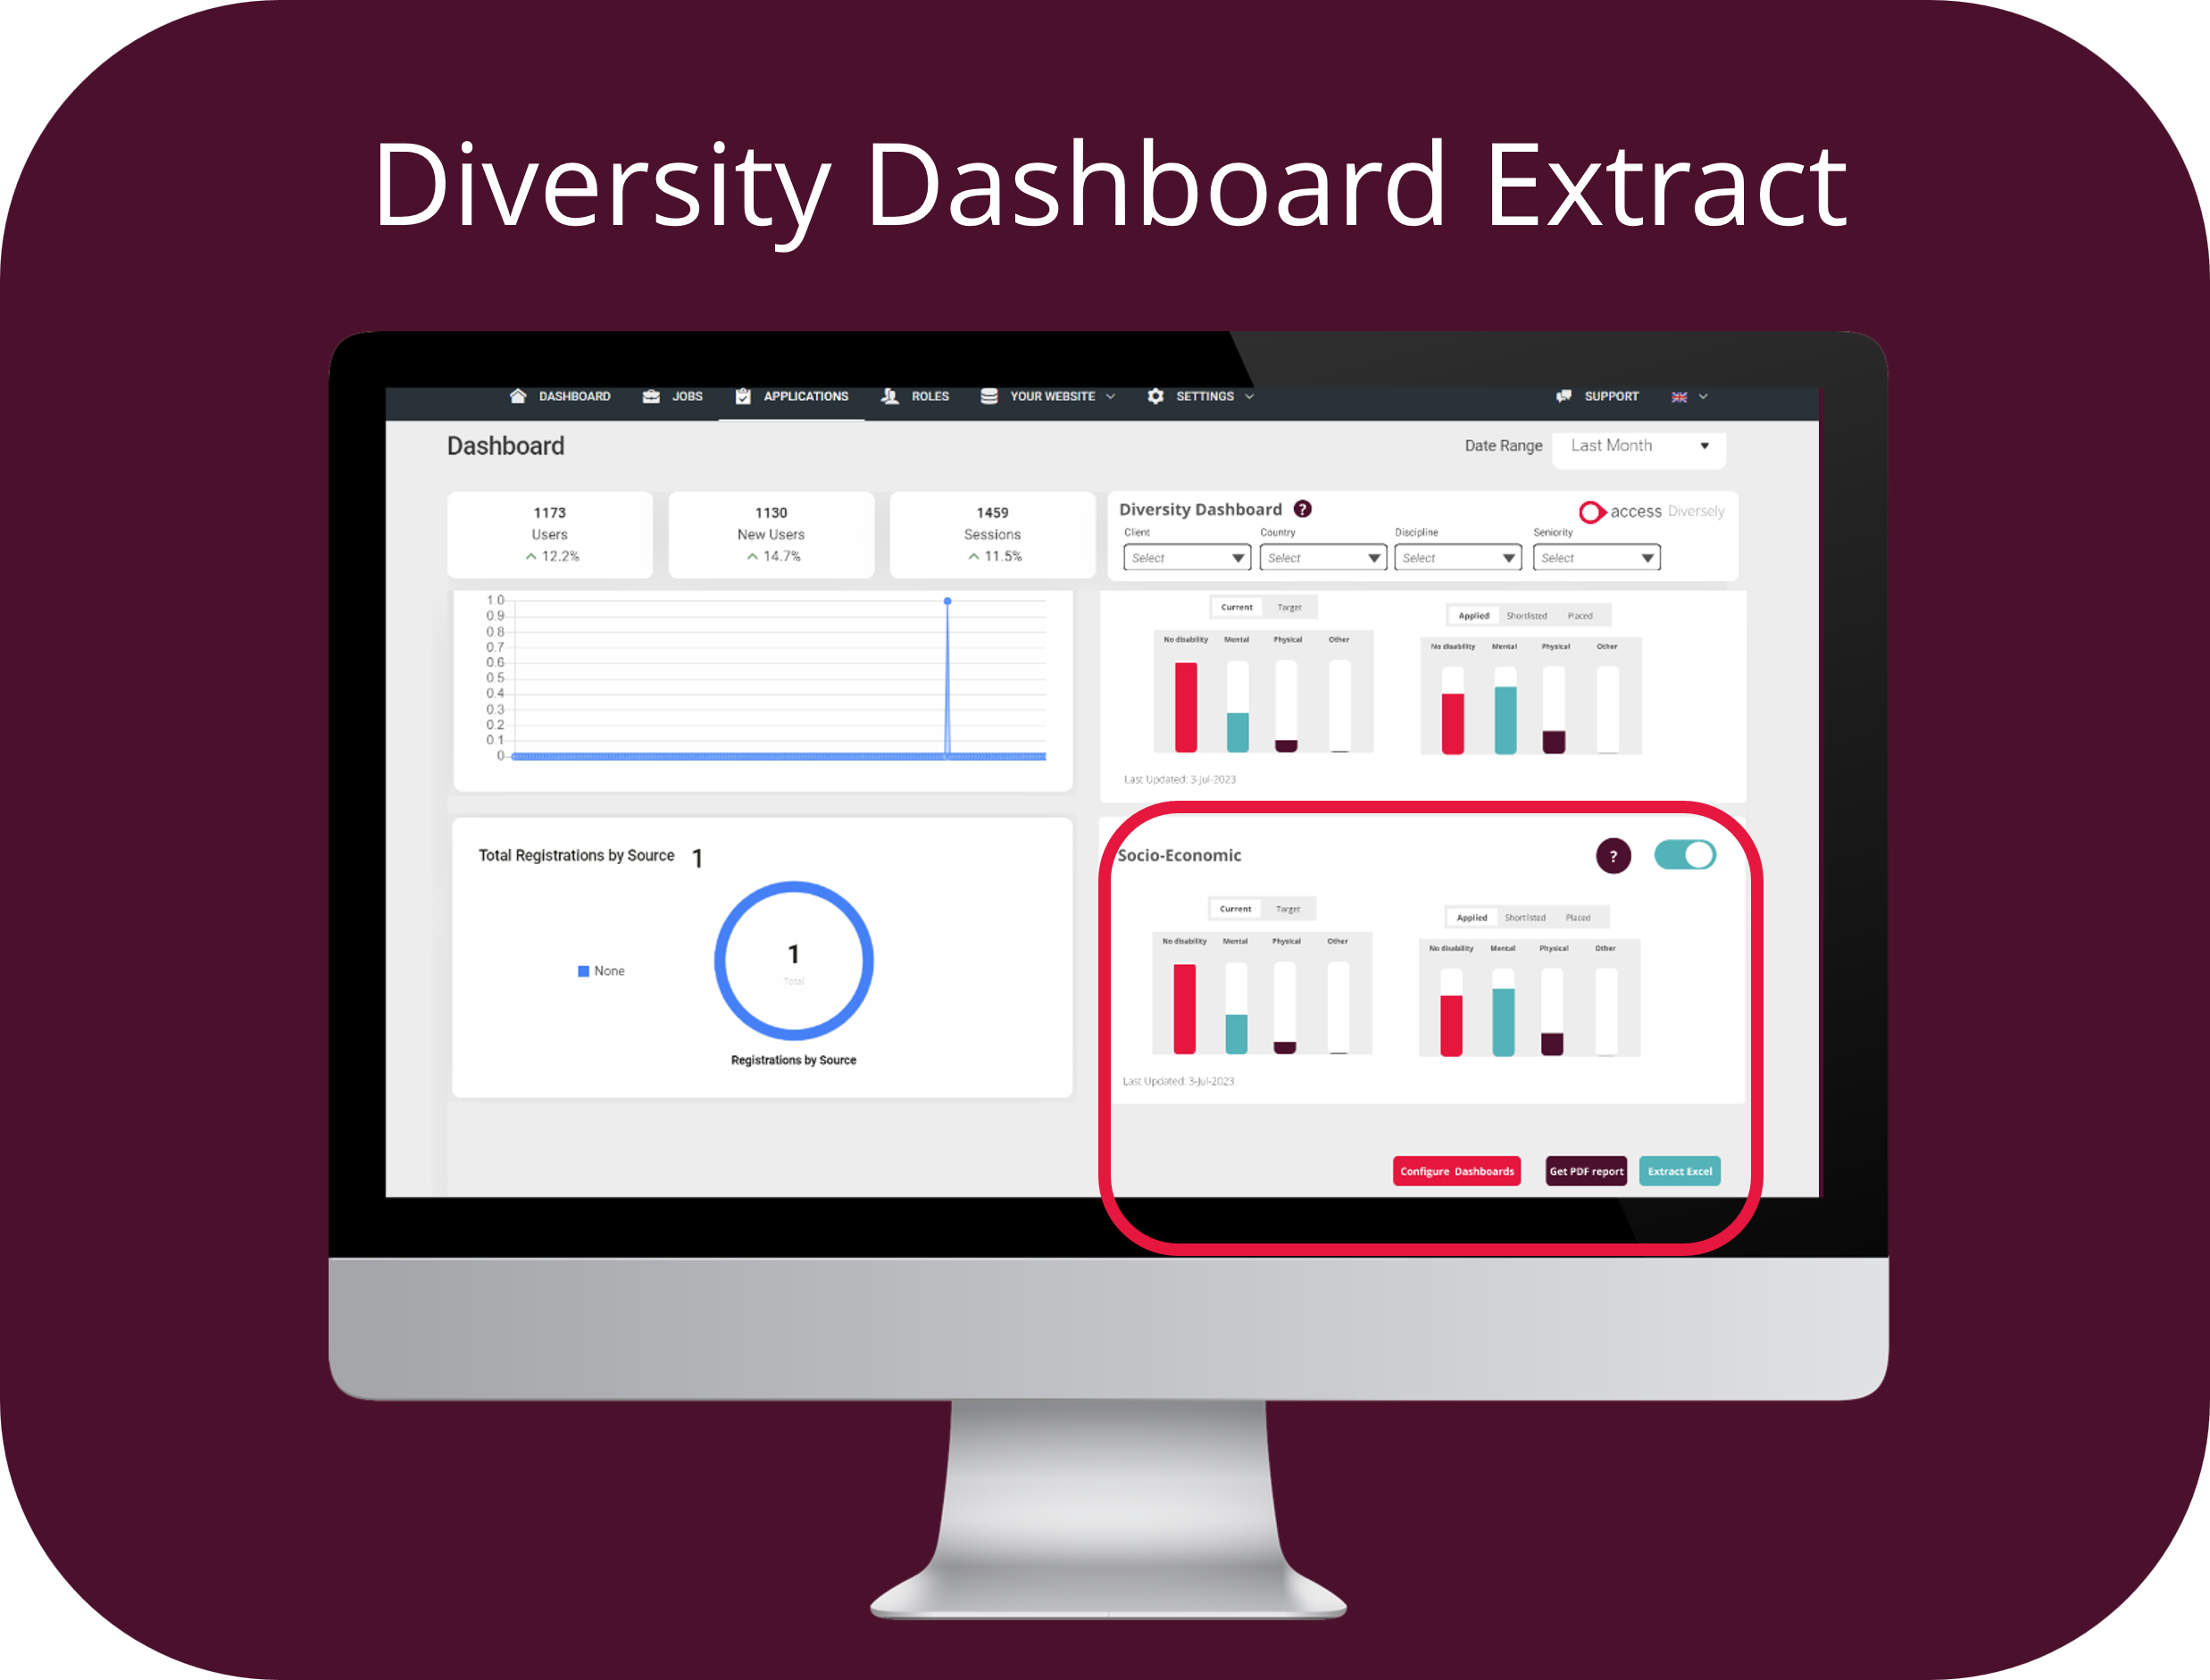
2. Extracting and sharing dashboard data and graphs
In your diversity dashboard, when you scroll down to the end, you’ll find an option to export your diversity data in either a PDF report or excel format.
Within excel format, the system will also allow you to break down that data by specific job id/ job title if helpful. This data will be fully anonymised, so without personal applicant details, however insightful to understand your diversity trends at various levels.
Within PDF report, the system will produce an exact copy of the diversity dashboards displayed. Any filters that you’ve applied, will also apply to the PDF report.
You will receive an email to your registered email address containing the password to open the secured file(s).